On facebook a friend was asking about learning to code to become better at profiling on his indie projects and identifying when things are cpu vs gpu bound. I wrote up a bit about my experiences profiling effects and thought it might be apropos for discussion here too. Do any of you have other opinions/tips on profiling troubled scenes? Discuss below!
Here’s what I wrote:
“More so than learning to code, I’d recommend he look toward becoming an expert at profiling tools first. Things like pix for Xbox and razor for ps4. There’s similar for pc dev, I’ve got a msg out to my former cto about the name of it.
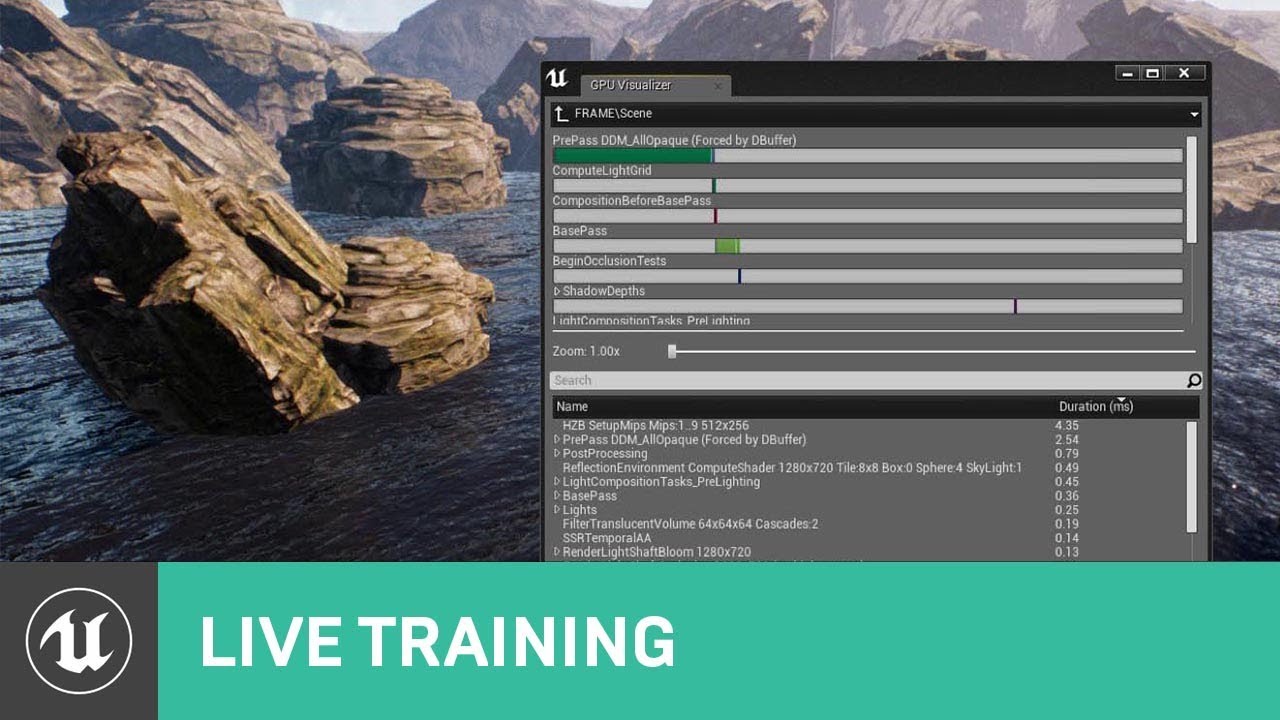
As an effects artist, I found the above profilers we used invaluable to identifying where a scene went wrong. Often, when effects are involved, it’s a gpu problem where a particle system was filling the screen with too many large particles. Sometimes a physics or an fx light overage. More rarely, too many instances spawning at once or overuse of a very expensive technique like our custom time of flight physics particles. I could capture a lagging frame with pix and see nanosecond timings of every single draw call call… and step through them, watching as each draws. That gives you a great targeted way to identify the worst offender (layer with the largest nanosecond timing, like <1,000,000 which is 1 ms of our 3ish ms fx gpu budget… and when you spot a layer that is over budget… stepping through allows you to visually identify what effect its coming from. There’s also a materiel name associated with that line item, which narrows the problem to “which layer within this effect is the offender.”
This is about as deep as I’d go with pix and razor but it’s just as useful for finding non fx related issues.
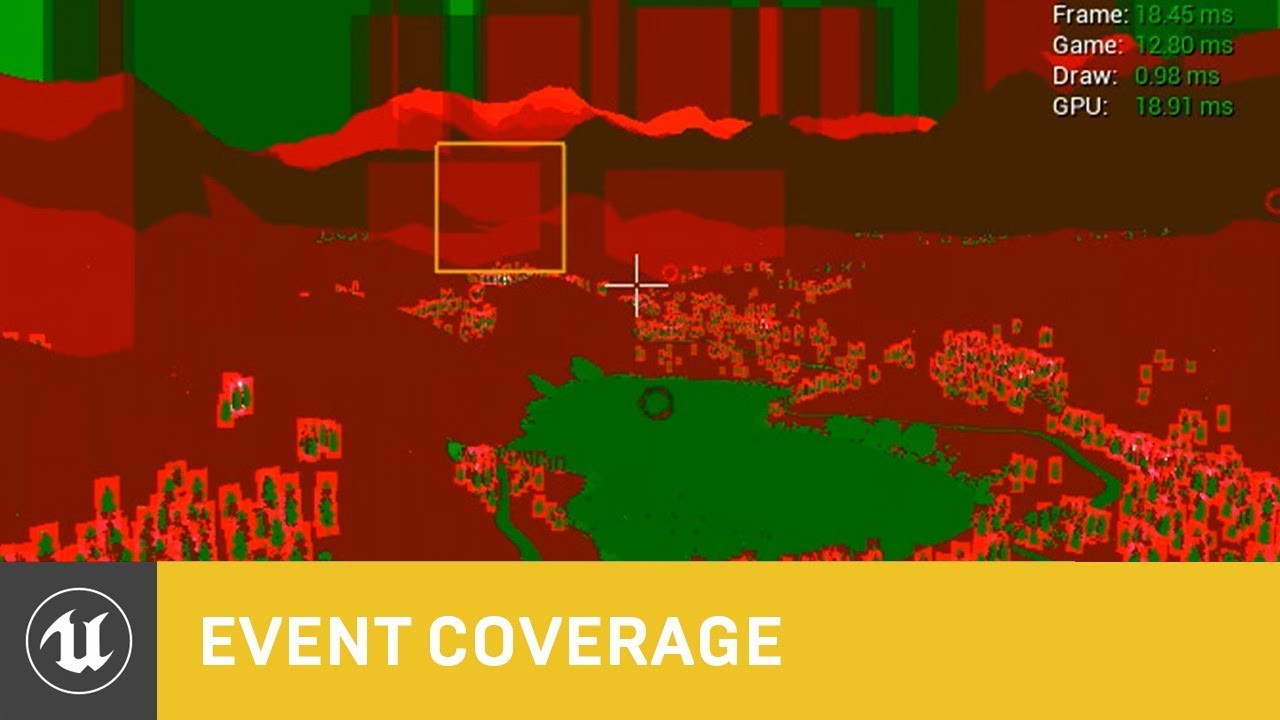
Though, toward the end of my time at IW, our CTO had us (the fx programmer) moving as much of this debug data as possible directly into in game overlays. For example we added the ability to see cpu load of each effect, the physics cost, etc… in addition to the list of live effects and their instance counts and particle counts.
Another tip that I’m not sure if this translates to other engines and is conceptually a bit confusing was our quickie “is it gpu or cpu bound” trick. Here’s how it worked… when a scene has dipping framerate, we would send a command to our engine to disable framerate capping (the cod engine locks the game to 60fps or less). When you do… if you see the FPS jump to above 60, this means that you were CPU bound. If it did not jump up, this means that you were GPU bound. Why is that? It’s been months since I left, so the why is getting blurry to me (and I may have the result flipped), but it was something like… uncapping the framerate will result in the same framerate before and after If you are gpu bound. The engine isn’t able to draw the scene in the allotted 16.6ms that is required for 60fps. Whether or not we cap the framerate has no bearing on that, so the FPS doesn’t change. However if you are cpu bound, uncapping the framerate… here’s where I’m blurry, would cause the framerate to raise. It’s something like… if you uncap the framerate and the framerate rises then it wasn’t the gpu that was holding you at that lower number, it’s therefore the cpu. Otherwise if the gpu is taking longer to process than the cpu then you are already showing the longer of the two… the gpu clamp where the number wouldn’t move.
Anyway, I’d recommend your friend first look int all the debug overlays that are already available in unity or unreal or whatever he’s using. Then have him dig into pix or pix for windows, or razor, etc… I learned all of these through people at work that knew them and I documented it on our internal wiki. I wonder if anyone had made intro YouTube videos?"


